Plot static volcano plot.
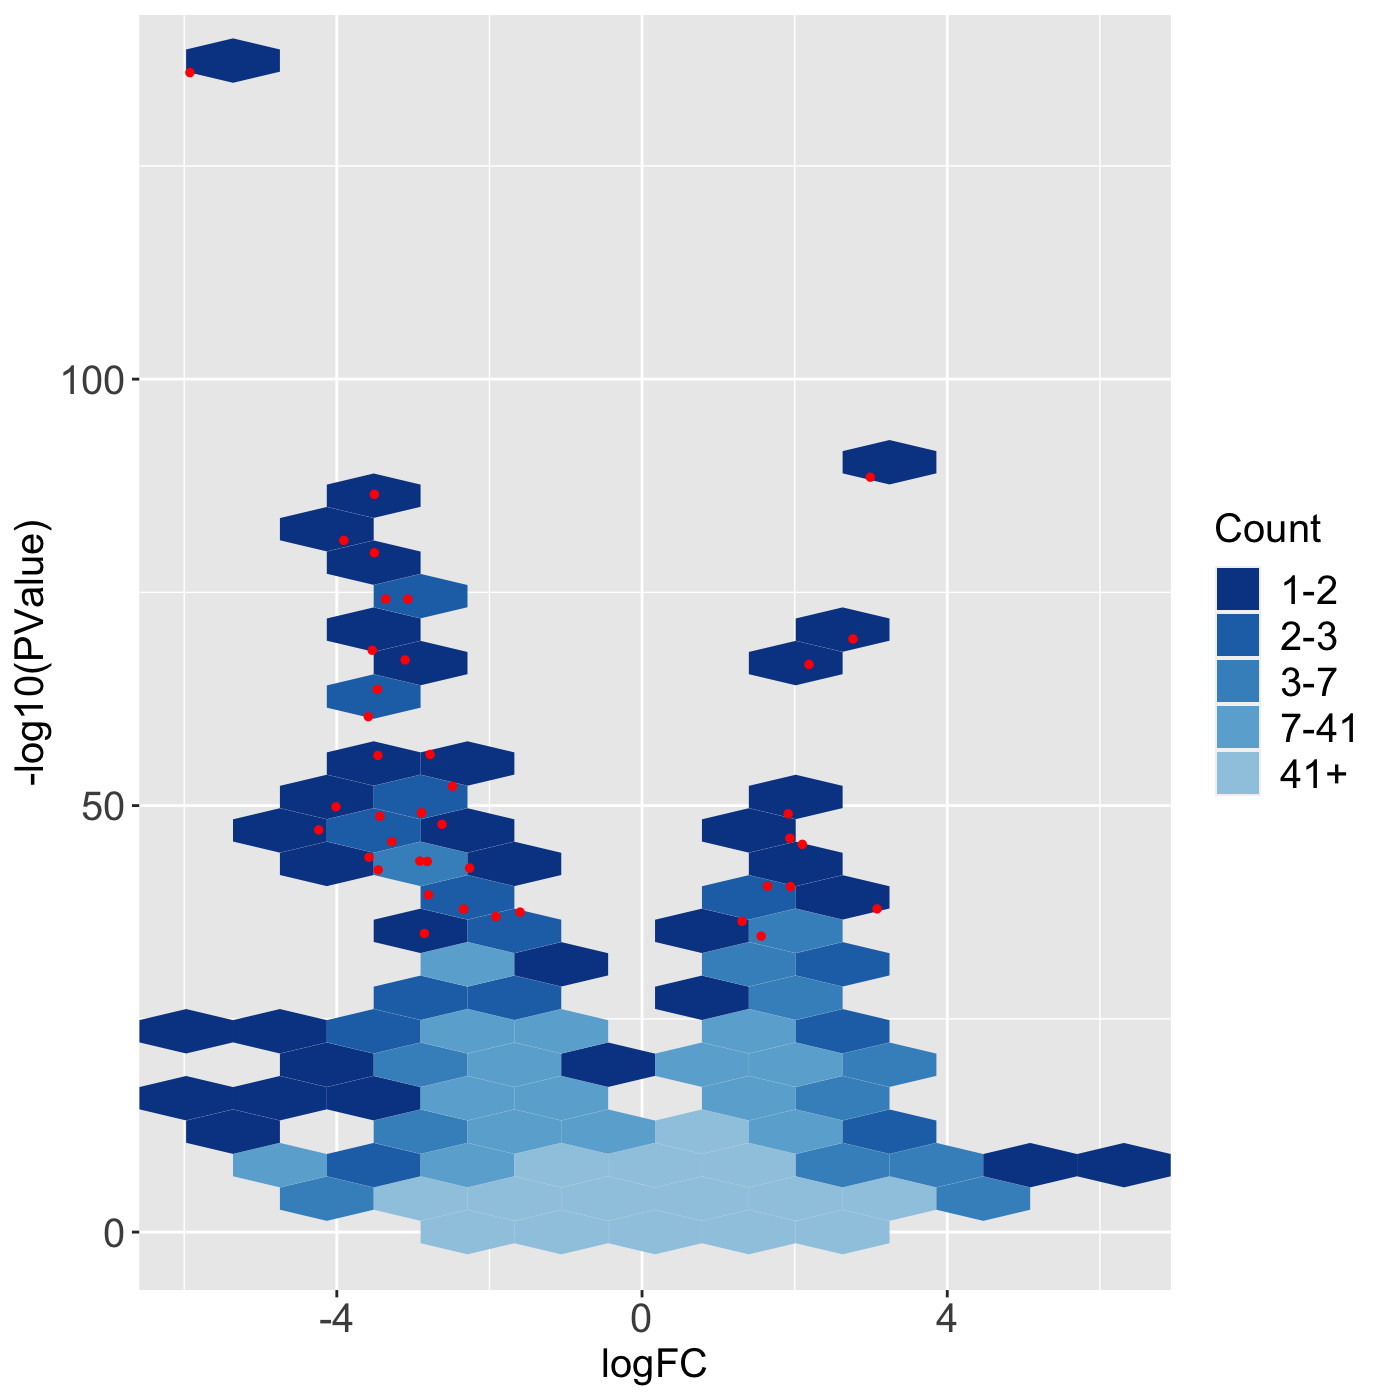
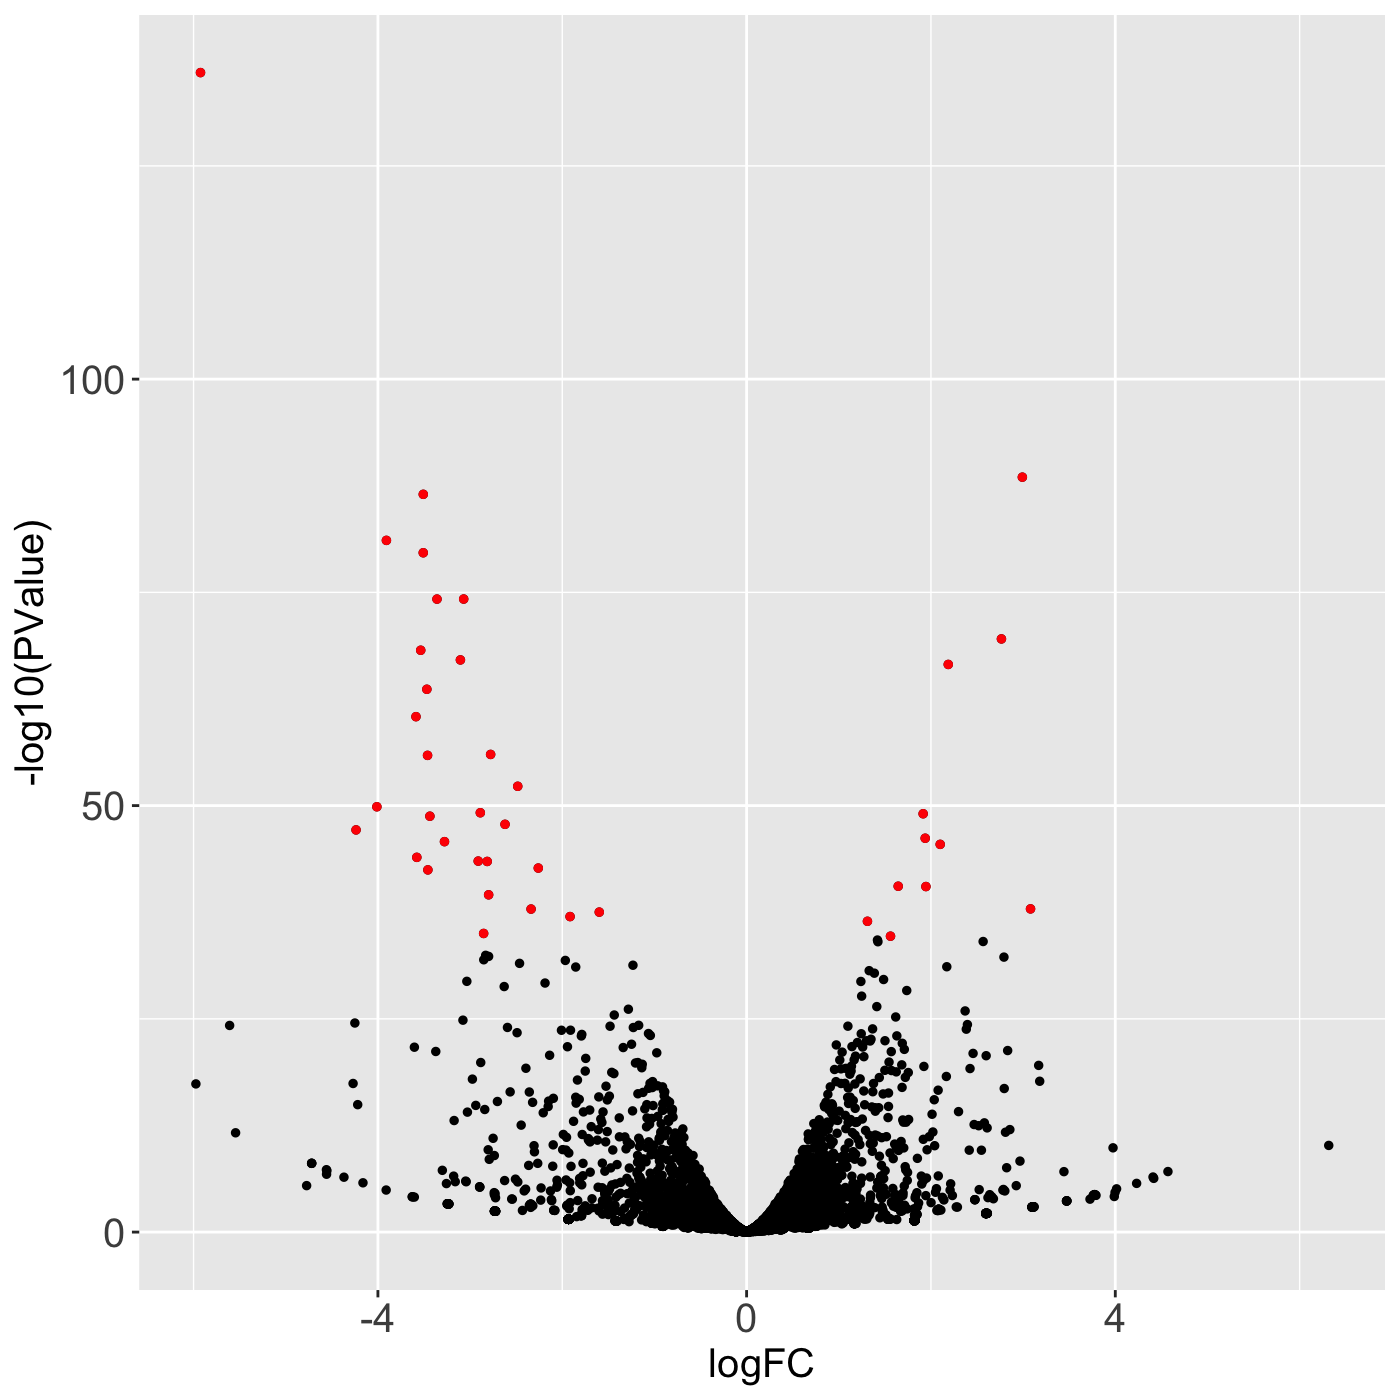
plotVolcano(
  data = data,
  dataMetrics = dataMetrics,
  dataSE = NULL,
  geneList = NULL,
  threshVar = "FDR",
  threshVal = 0.05,
  option = c("hexagon", "allPoints"),
  logFC = "logFC",
  PValue = "PValue",
  xbins = 10,
  pointSize = 0.5,
  pointColor = "orange",
  outDir = tempdir(),
  saveFile = TRUE,
  hover = FALSE
)
Arguments
| data | DATA FRAME | Read counts |
|---|---|
| dataMetrics | LIST | Differential expression metrics. This object must contain one column with magnitude changes (for the logFC parameter) and one column with statistical values (for the PValue parameter), unless geneList is not NULL |
| dataSE | SUMMARIZEDEXPERIMENT | Summarized experiment format that can be used in lieu of data and dataMetrics; default NULL |
| geneList | CHARACTER ARRAY | List of gene IDs to be drawn onto the scatterplot matrix of all data. Use this parameter if you have predetermined subset of genes to be superimposed. Otherwise, dataMetrics, threshVar, and threshVal will be used to create genes to be superimposed onto the volcano plot; default NULL |
| threshVar | CHARACTER STRING | Name of column in dataMetrics object that is used to determine genes to be overlaid; default "FDR" |
| threshVal | INTEGER | Maximum value to threshold significance from threshVar object; default 0.05 |
| option | CHARACTER STRING ["hexagon" | "allPoints"] | The background of plot; default "hexagon" |
| logFC | CHARACTER STRING | Name of column in dataMetrics object that contains log fold change values; default "logFC" |
| PValue | CHARACTER STRING | Name of column in dataMetrics object that contains p-values; default "PValue" |
| xbins | INTEGER | Number of bins partitioning the range of the plot; default 10 |
| pointSize | INTEGER | Size of plotted points; default 0.5 |
| pointColor | CHARACTER STRING | Color of overlaid points on scatterplot matrix; default "orange" |
| outDir | CHARACTER STRING | Output directory to save all plots; default tempdir() |
| saveFile | BOOLEAN [TRUE | FALSE] | Save file to outDir; default TRUE |
| hover | BOOLEAN [TRUE | FALSE] | Allow to hover over points to identify IDs; default FALSE |
Value
List of n elements of volcano plots, where n is the number of treatment pair combinations in the data object. The subset of genes that are superimposed are determined through the dataMetrics or geneList parameter. If the saveFile parameter has a value of TRUE, then each of these volcano plots is saved to the location specified in the outDir parameter as a JPG file.
Examples
# The first set of four examples use data and dataMetrics objects as # input. The last set of four examples create the same plots now # using the SummarizedExperiment (i.e. dataSE) object input. # Example 1: Plot volcano plot with default settings for overlaid points # (FDR < 0.05). data(soybean_ir_sub) data(soybean_ir_sub_metrics) ret <- plotVolcano(soybean_ir_sub, soybean_ir_sub_metrics, pointSize = 1, saveFile = FALSE) ret[[1]]# Example 2: Plot volcano plot and overlay points with PValue < 1e-15. ret <- plotVolcano(soybean_ir_sub, soybean_ir_sub_metrics, pointColor = "red", pointSize = 1, threshVar = "PValue", threshVal = 1e-15, saveFile = FALSE) ret[[1]]# Example 3: Plot volcano plot and overlay points with PValue < 1e-15. This # time, plot all points (instead of hexagons) for the background. ret <- plotVolcano(soybean_ir_sub, soybean_ir_sub_metrics, pointColor = "red", pointSize = 1, threshVar = "PValue", threshVal = 1e-15, option = "allPoints", saveFile = FALSE) ret[[1]]# Example 4: Plot volcano plot with points in background and overlay points # with PValue < 1e-15. This time, use a value of TRUE for the hover # parameter so that you can hover over overlaid points and determine their # IDs. ret <- plotVolcano(soybean_ir_sub, soybean_ir_sub_metrics, pointColor = "red", pointSize = 1, threshVar = "PValue", threshVal = 1e-15, option = "allPoints", saveFile = FALSE, hover = TRUE) ret[[1]] # Below are the same four examples, only now using the # SummarizedExperiment (i.e. dataSE) object as input. # Example 1: Plot volcano plot with default settings for overlaid points # (FDR < 0.05). if (FALSE) { data(se_soybean_ir_sub) ret <- plotVolcano(dataSE = se_soybean_ir_sub, pointSize = 1, saveFile = FALSE) ret[[1]] } # Example 2: Plot volcano plot and overlay points with PValue < 1e-15. if (FALSE) { ret <- plotVolcano(dataSE = se_soybean_ir_sub, pointColor = "red", pointSize = 1, threshVar = "PValue", threshVal = 1e-15, saveFile = FALSE) ret[[1]] } # Example 3: Plot volcano plot and overlay points with PValue < 1e-15. This # time, plot all points (instead of hexagons) for the background. if (FALSE) { ret <- plotVolcano(dataSE = se_soybean_ir_sub, pointColor = "red", pointSize = 1, threshVar = "PValue", threshVal = 1e-15, option = "allPoints", saveFile = FALSE) ret[[1]] } # Example 4: Plot volcano plot with points in background and overlay points # with PValue < 1e-15. This time, use a value of TRUE for the hover # parameter so that you can hover over overlaid points and determine their # IDs. if (FALSE) { ret <- plotVolcano(dataSE = se_soybean_ir_sub, pointColor = "red", pointSize = 1, threshVar = "PValue", threshVal = 1e-15, option = "allPoints", saveFile = FALSE, hover = TRUE) ret[[1]] }